


The Global Burden of Disease Study: How Life Sciences Companies Use It, From Pipeline to Pricing
If you sit in enough pharma strategy meetings, one dataset comes up again and again: the Global Burden of Disease study. Run by the Institute for Health Metrics and Evaluation (IHME) at the University of Washington, it is the most comprehensive attempt to measure how, where and why people lose health around the world, and it has become a common reference point from early portfolio strategy all the way to pricing negotiations.
This guide explains what the GBD study measures, how life sciences companies use it across the product lifecycle, and the limits to keep in mind before you put its numbers in a forecast or a payer dossier.
Key Takeaways
- GBD 2023 covers 375 diseases and injuries and 88 risk factors across 204 countries and territories, with estimates from 1990 to 2023.
- Its core metric, the DALY, puts fatal and non-fatal conditions on one scale, so a disabling chronic disease can be compared with one that kills.
- Companies use GBD for therapeutic area selection, market sizing, trial planning, value dossiers, and pricing and access.
- The figures are modelled estimates with uncertainty intervals, not counts, and should be treated that way.
- The data are free for non-commercial use; commercial use generally needs a licence from IHME.
What the GBD Study Is
375
Diseases and injuries
88
Risk factors
204
Countries and territories
310,000+
Data sources
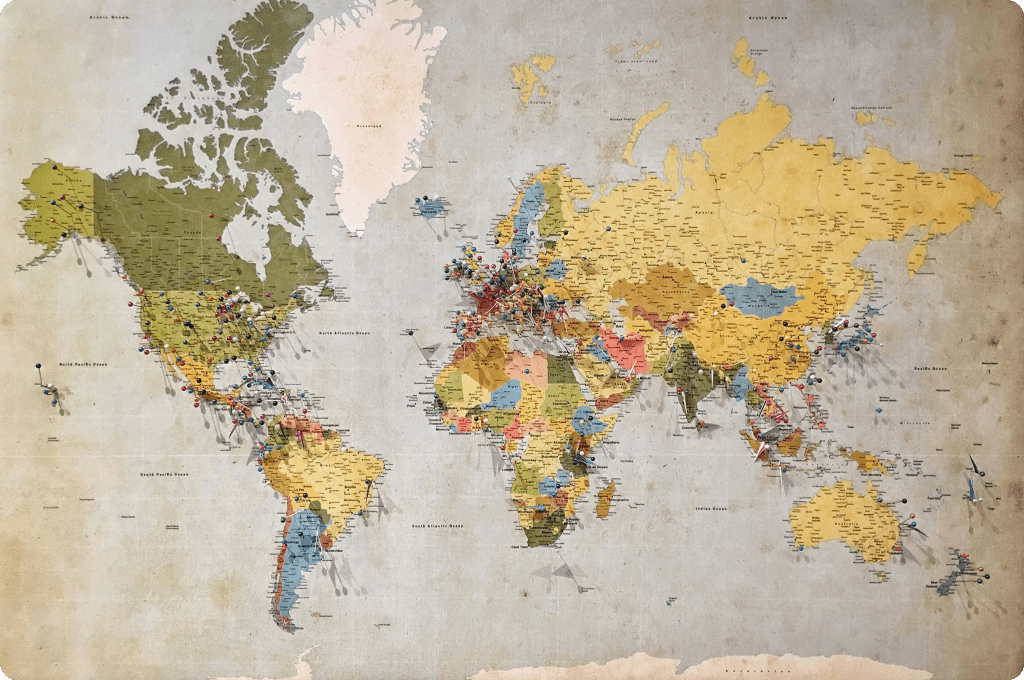
The latest round, GBD 2023, was published in The Lancet on 18 October 2025 (GBD 2023 paper). It draws on more than 310,000 data sources, about 30% of them new to this round, including vital registration, surveys, disease registries, hospital records and published studies. Estimates are produced for 204 countries and territories and around 660 subnational locations, by age and sex.
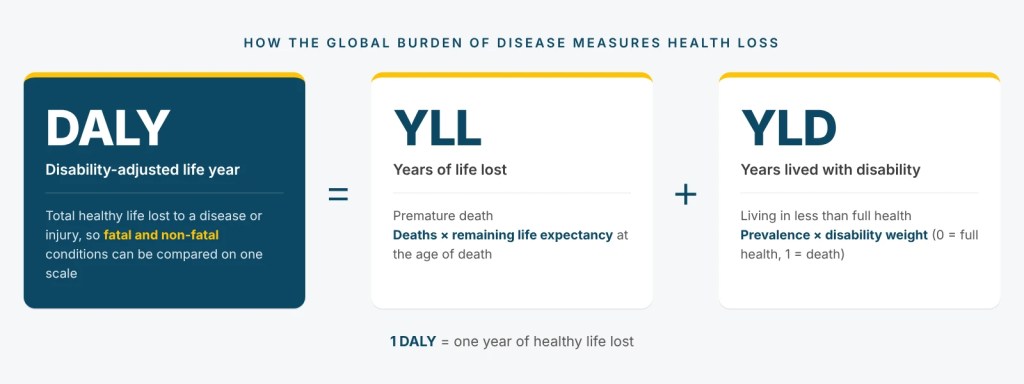
GBD reports deaths, prevalence and incidence, but its signature measure is the disability-adjusted life year (DALY). One DALY is one year of healthy life lost. It adds together years of life lost to early death (YLL) and years lived with disability (YLD), so conditions such as depression or low back pain, which rarely kill but cause enormous disability, sit on the same scale as heart disease or cancer.
IHME makes the results available through free online tools: GBD Compare for interactive charts and maps, the GBD Results tool for downloading estimates, and the Global Health Data Exchange (GHDx) for the underlying sources and methods (IHME).
What GBD 2023 shows
Non-communicable diseases caused about 1.80 billion DALYs in 2023, roughly two-thirds of all health loss worldwide. The leading causes were ischaemic heart disease (193 million DALYs), stroke (157 million) and diabetes (90.2 million). Among communicable, maternal, neonatal and nutritional conditions, neonatal disorders and lower respiratory infections remained the largest causes.
How Life Sciences Companies Use GBD
Because GBD covers almost every condition, country and age group with one consistent method, it gives teams across a company a shared starting point. Here is where it typically shows up.
1. Choosing Where to Innovate
Portfolio and R&D strategy teams use DALYs and trends to compare unmet need across therapeutic areas and regions. Rising burdens, such as diabetes, chronic kidney disease or dementia in ageing populations, help make the case for investment, while risk-factor data (obesity, high blood pressure, air pollution) point to where future burden is heading.
2. Sizing Markets and Building Forecasts
Prevalence and incidence by country, age and sex are a common input to the top of a patient-based forecast, especially in markets where local epidemiology is thin or out of date. GBD gives a consistent baseline to compare countries, which analysts then refine with diagnosis, treatment and pricing assumptions.
3. Planning Clinical Development
Clinical teams use burden and incidence data to choose indications and countries, judge how easily patients can be recruited, and make sure trial populations reflect the people who carry the disease. It also helps justify development in regions that are under-represented in trials.
4. Building the Value Story
Health economics and outcomes research (HEOR) teams cite GBD to describe the burden of a disease in global value dossiers and payer submissions. DALYs feed cost-effectiveness analysis, particularly the “cost per DALY averted” measure used by many global health funders and low- and middle-income country decision-makers.
“GBD gives every team, from R&D to market access, the same map of where the world’s health needs lie.”
5. Pricing and Market Access After Approval
Once a product is on the market, burden data support conversations with payers and governments about priority and value. Country-level estimates also inform tiered pricing and access programs in low- and middle-income countries, where the gap between burden and treatment is often widest.
6. Medical Affairs, Policy and Corporate Strategy
Medical affairs and policy teams use GBD in disease-awareness work and advocacy. Corporate teams draw on it for access-to-medicine and ESG reporting, and business development teams use it to sense-check the epidemiology behind licensing and acquisition targets.
| Stage | How GBD is used | Typical metrics |
|---|---|---|
| Portfolio strategy | Compare unmet need by therapeutic area and region; spot rising burdens | DALYs, YLDs, trends since 1990 |
| Market sizing and forecasting | Epidemiology baseline for patient-based forecasts | Prevalence and incidence by age, sex and country |
| Clinical development | Choose indications and countries; plan representative trial populations | Incidence, deaths, risk-factor exposure |
| Value and HEOR | Burden of disease in dossiers; cost-effectiveness models | DALYs, YLLs, YLDs, cost per DALY averted |
| Pricing and access | Payer and government discussions; tiered pricing and access programs | Burden by country and income group |
| Policy and corporate strategy | Advocacy, access-to-medicine and ESG reporting, business development diligence | Risk-attributable burden, trends |
Know the Limits
GBD is powerful, but it is easy to misuse. Before relying on it, keep these points in mind:
- Estimates, not counts. Where data are sparse, figures are modelled. Report the uncertainty intervals, not just the central estimate.
- Broad categories. GBD causes are often wider than a product’s target population. A cancer or disease subtype may need other sources to size.
- Burden is not a market. High burden does not mean patients are diagnosed, treated or able to pay. Forecasts still need diagnosis, treatment and pricing data.
- Rounds are revised. Each round re-estimates the whole series back to 1990, so don’t mix figures from different rounds.
- Licensing. GBD data are free for non-commercial use. Commercial use, including in client work or paid products, generally needs a licence from IHME, so check the data use agreement first.
What This Means for Your Strategy
The GBD study is not a forecast or a market model, but it is the best common language available for describing health need around the world. Used well, with its uncertainty and limits in view, it can anchor portfolio choices, sharpen forecasts and strengthen the value story with payers.
Terraforme Biosciences helps life sciences companies and investors turn epidemiology and market data into strategy. Explore our strategy and business development services or our M&A support.
Sources
- Institute for Health Metrics and Evaluation, Global Burden of Disease (GBD)
- GBD 2023 Collaborators. Burden of 375 diseases and injuries, risk-attributable burden of 88 risk factors, and healthy life expectancy in 204 countries and territories, including 660 subnational locations, 1990–2023. The Lancet, 2025;406:1873–1922
- IHME, Free-of-Charge Non-commercial User Agreement
At a glance
375
Diseases and injuries
88
Risk factors
204
Countries and territories
310,000+
Data sources
Building a market or access strategy?
Related Insights

Turning Burden-of-Disease Data into Strategy?
We help life sciences companies and investors use epidemiology and market data to guide portfolio, forecasting and market access decisions.

